
Since 6/17/22, Technology and growth-related sectors have made stunning recoveries. The Nasdaq Composite Index (COMPQ), Nasdaq 100 Index (NDX), and Technology sector (XLK) outperformed their peers by wide margins.
The question becomes, can mega-cap technology names and growth sectors retain their leadership roles?
Can this be the catalyst that leads to the resumption of the structural bull?
Let’s look at the performances of popular indexes since the mid-Jun market bottom and review seasonality and RRG studies to determine if this is a temporary move (i.e., an oversold rally) or the start of a sustainable bull rally (i.e., cyclical or structural bull).
Nasdaq 100 Index (NDX +18.15%), Nasdaq Composite Index (COMPQ +17.80%), S&P 500 Index (SPX +12.98%), S&P 600 Small Cap Index (SML +12.62%), S&P 400 Mid Cap Index (MID +12.16%), Dow Jones Industrial Average (INDU +9.50%), and NYSE Composite Index (NYA +8.00%).
NDX and COMPQ have been the winners over the past 33-days, outperforming the benchmark SPX Index by over 5%.
The RRG study on stock market indexes also shows rotations favoring NDX and COMPQ as both technology-laden markets continue to rise within the Improving Quadrant. All other indexes, including the SPX Index, reside within the Weakening Quadrant.
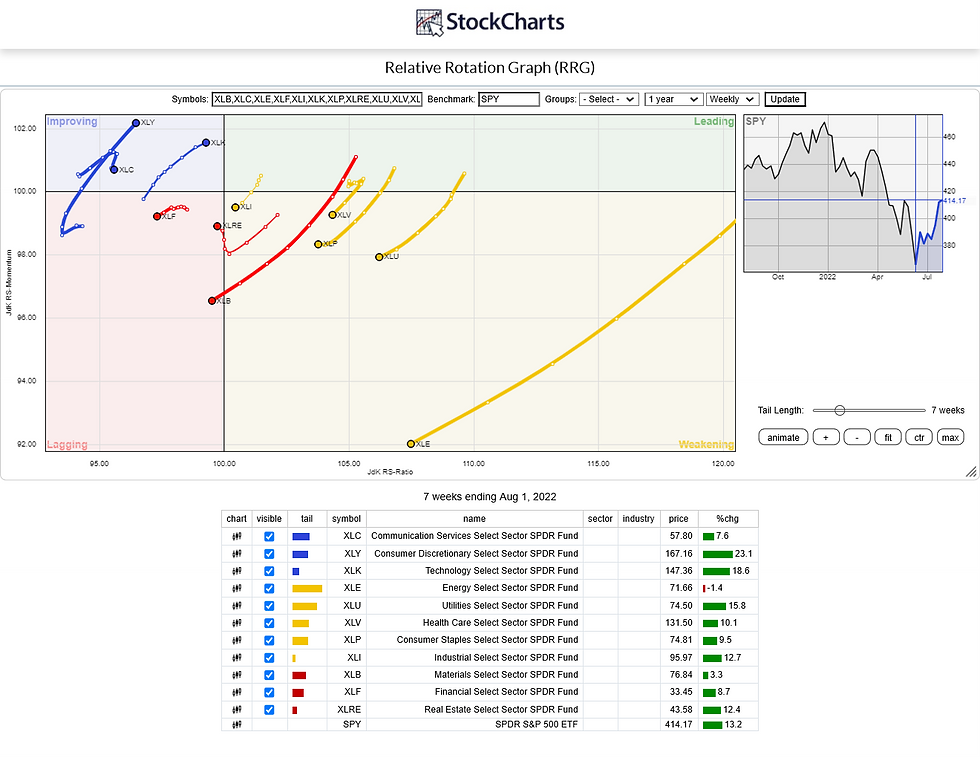
A review of the 11 S&P sectors over the past 33-days confirms the Technology sector’s emerging leadership.
Consumer Discretionary (XLY +23.11%), Technology (XLK +18.55%), Utilities (+15.76%), Industrials (XLI +12.66%), Real Estate (XLRE +12.41%), Healthcare (XLV +10.15%), Staples (XLP +9.5%), Financials (XLF +8.72%), Communication Services (XLC +7.61%), Materials (XLB +3.27%), and Energy (XLE -1.40%).
The RRG study further confirms the rotation toward the Technology sector. For the past 7-weeks, Technology (XLK) and Consumer Discretionary (XLY) have been climbing higher within the Improving Quadrant. XLK is within striking distance of the Leading Quadrant.
From a seasonality perspective, August is a mixed month for market indexes. Market indexes displayed wide dispersions in the past 20 years. However, August favored the Nasdaq markets. Average monthly returns for the indexes are NDX +1.4%, COMQP +1.0%, SPX +0.3%, INDU +0.1%, SML +0.0%, MID -0.1%, and NYA -0.3%.
The seasonality study further shows August to be a mixed month for the 11 S&P sectors over the past 20 years. Technology (XLK +1.4%), Real Estate (XLRE +1.4%), Consumer Discretionary (XLY +1.0%), Utilities (XLU +0.7%), Consumer Staples (XLP +0.5%), Communication Services (XLC +0.5%), Industrials (XLI +0.2%), Healthcare (XLV +0.2%), Financials (XLF +0.1%), Materials (XLB -0.2%), and Energy (XLE -1.40%).
Based on the above studies, Technology has shown dramatic improvements from its mid-Jun 2022 low. The studies suggest continued near-term relative outperformance in this sector, at least into the end of August and possibly early September. However, the chart of XLK suggests an inflection is near as the sector tests crucial resistance at 147-151 (top of the Dec 2021 downtrend channel, 50% retracement from Dec 2021-Jun 2022 decline, and the 200-day ma).
A convincing breakout above 151 reverses the primary downtrend and hints at the return of Technology as a leader over the intermediate to longer term. Because of the market capitalization of the Technology sector, it will continue to influence the directional trends of stock market indexes such as SPX, NDX, and COMPQ.


Comments